The Labels drop zone is used to label the chart with a measure other than the measure of the actual data point. You can add a single measure to the Labels zone. To display labels in the chart, you must also enable data labels from Component ribbon. If data labels are enabled, but no measure is added to the Labels zone, the value of the data point will be displayed (i.e., the chart's measure).
Note: The Labels drop zone is enabled for all Column charts, Bar charts, Line charts, Area charts, Segment charts, Radar charts, Plotted charts, and Advanced charts (excluding Sankey). Note that scatter chart labels display the member element of the data point, rather than the value.
Add Labels
If it is not already selected, select Data Labels on your visual's Component ribbon:

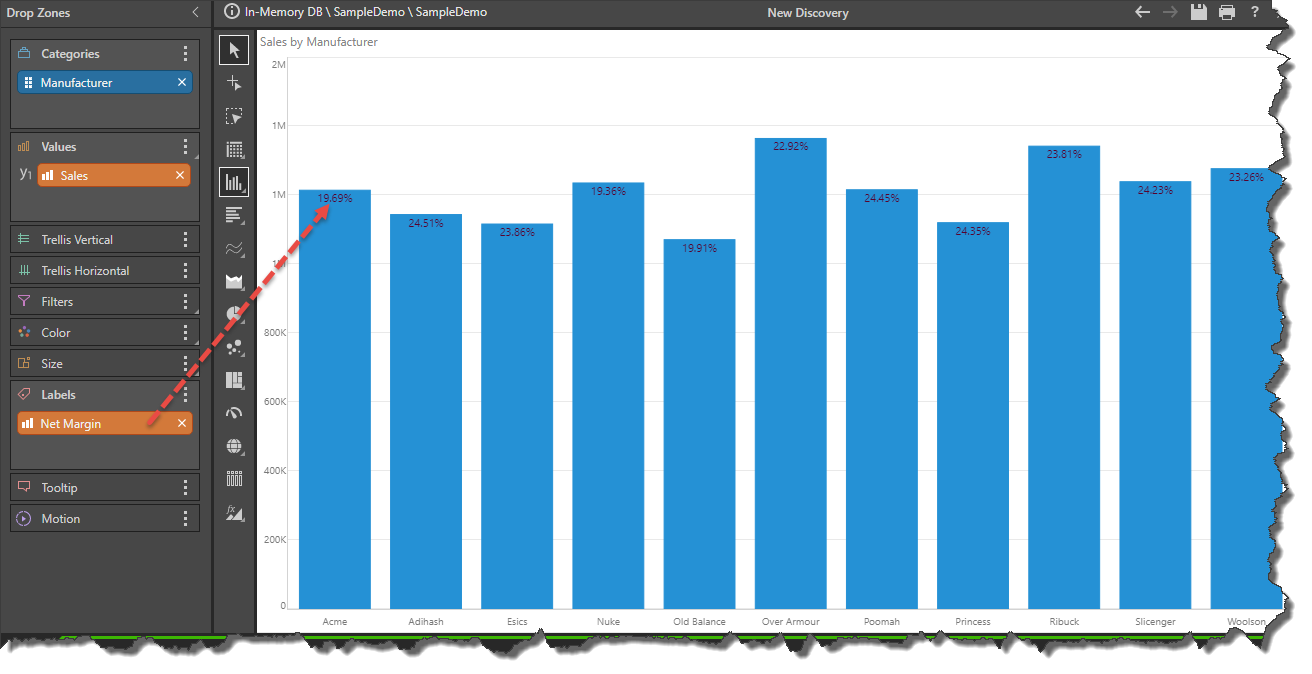
Add the measure that should be used to label the chart to the Labels drop zone. In this example, the chart displays Sales by Manufacturer, but the columns are labeled by Net Margin.
Multiple Measures
Combo Charts
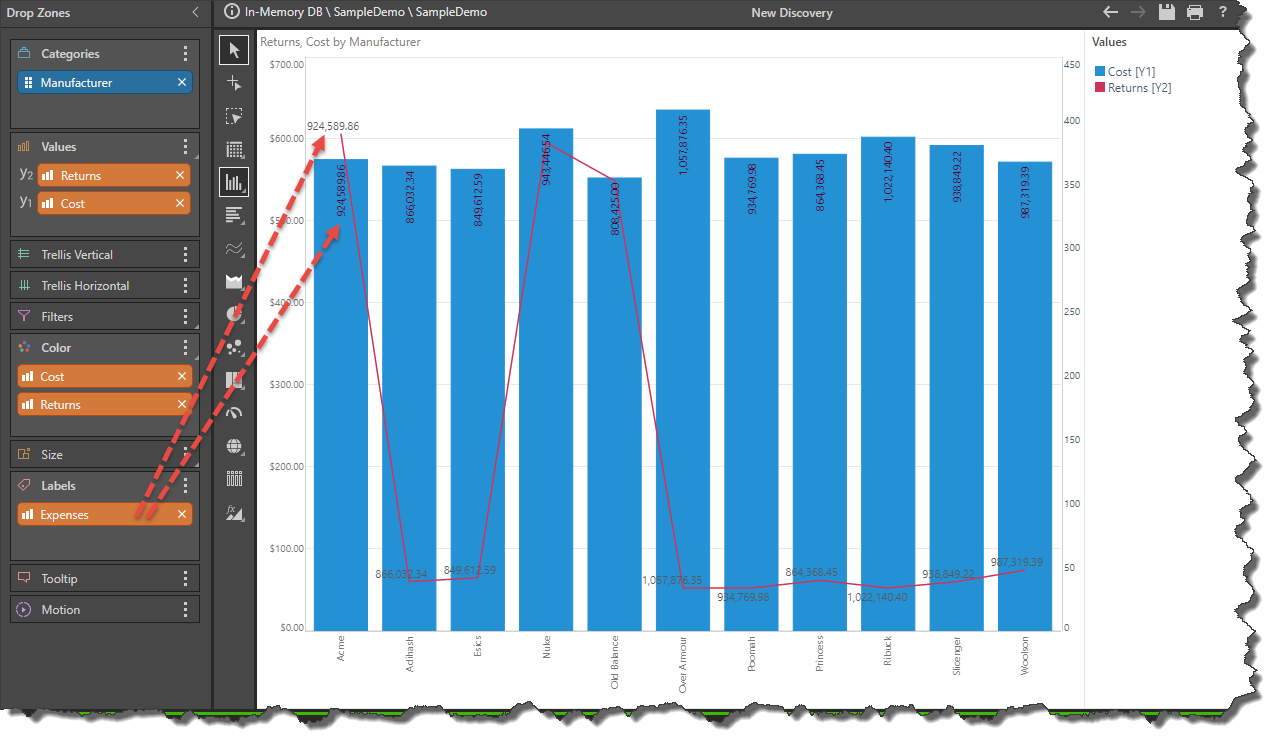
If there is a measure in the Labels zone, that measure will be used to label both charts in a combo chart, regardless of whether or not both the primary and secondary axes are used.
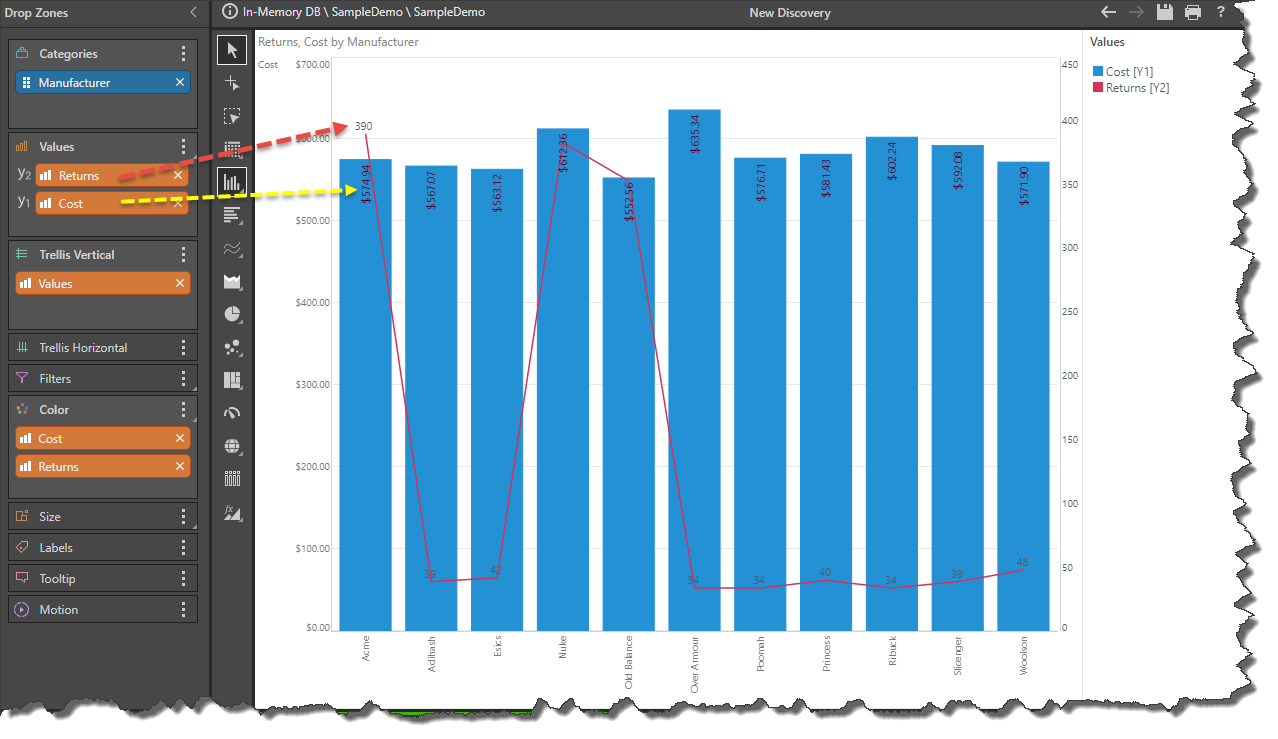
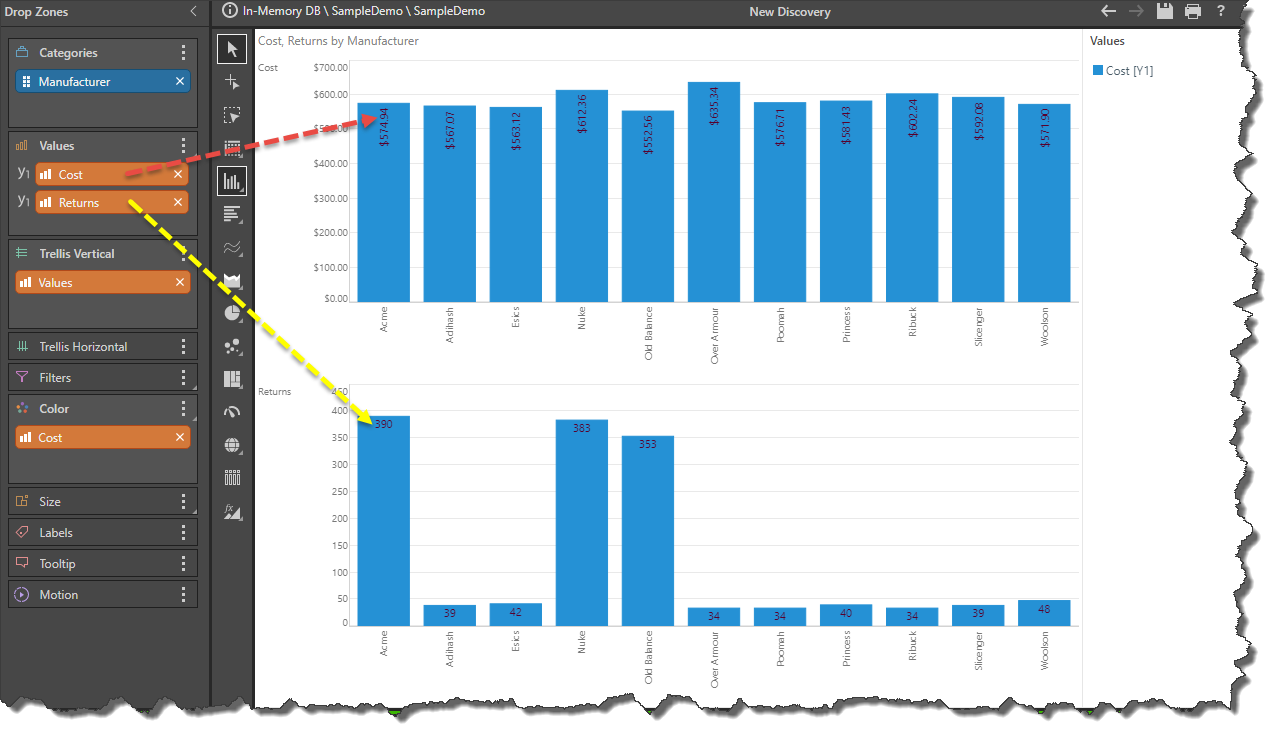
If labels are enabled, but no measure is added to the Labels drop zone, each chart will be labeled by the value of its data point.
Trellised Charts
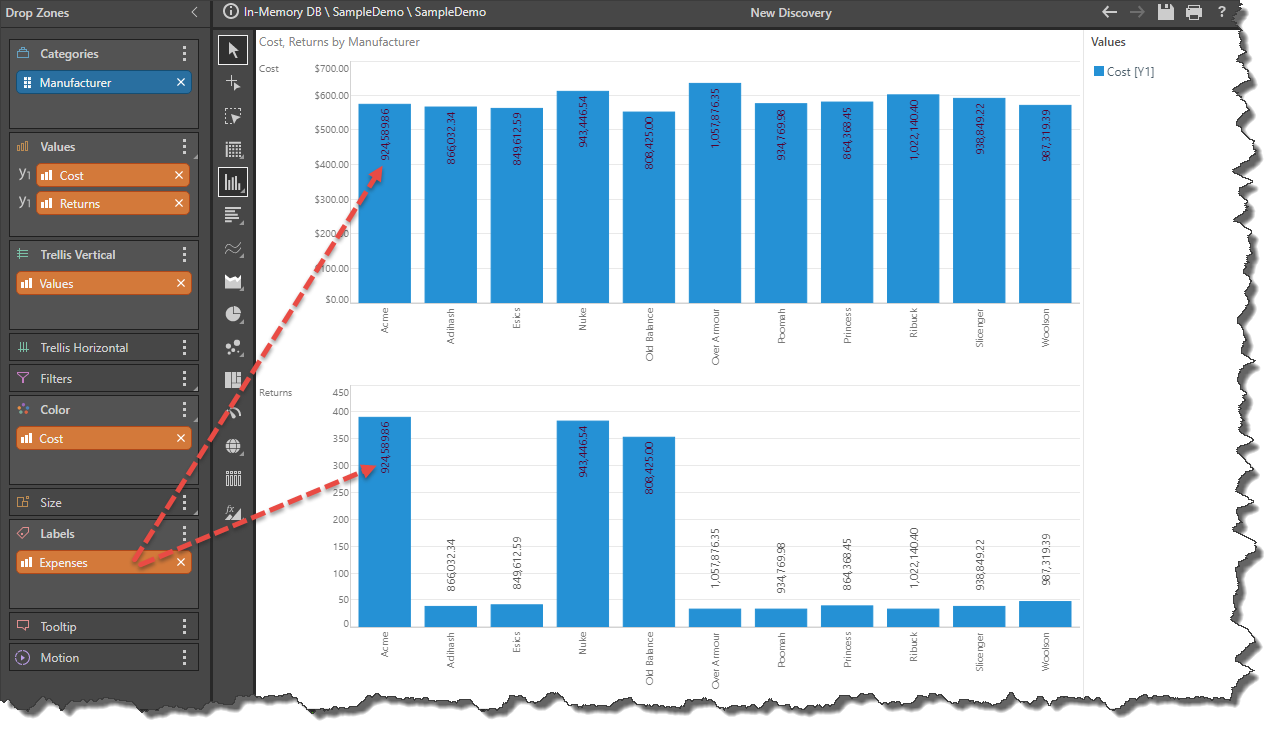
If a measure is added to the Labels zone, all trellised charts will be labeled according to that measure.
If labels are enabled, but no measures is added to the Labels zone, each trellised chart will be labeled by the value of its data point.
Formatting Data Labels
Once you have added your labels to your visual, you might want to configure the formatting used on those data labels to improve their appearance and readability. For more information on formatting, click here.